Live Statistics
Live Statistics
Live Statistics provides regularly updated performance monitoring and analytics for active projects, giving managers and supervisors detailed insights into productivity, quality metrics, and employee performance.
Overview
Live Statistics serves as a comprehensive dashboard for:
- Project Performance - Progress tracking and completion estimates
- Quality Metrics - Verification rates and correction statistics
- Employee Analytics - Individual productivity and performance data
- Operational Insights - Resource utilization and efficiency metrics
Access Requirements
Required Permissions:
| Permission | Level | Description |
|---|---|---|
| View | Project | View statistics for assigned projects which is associated with the user's role |
| Admin | System | View all project statistics |
Data Visibility:
- Project Users - See statistics for their assigned project only
- System Admins - Access statistics across all projects
- Registration Required
- If user has no global role, the user must be registered in the project or
- If the user has any global role above "Employee" and has access to the project or
- If the user has no permissions based on the global role, the user needs to be at least an Area Manager
Interface Layout
Data Refresh Indicator
The refresh cycle is every 15 minutes.
Last updated on Monday, November 3, 2025 2:30 PM
Top Status Cards

| Metric | Purpose |
|---|---|
| ETC (Estimated Time to Completion) | Predicted completion time |
| First Scan | When scanning work began on project |
| First Verify | When verification work began on project |
Main Metrics Grid
Current Stats

| Metric | Description |
|---|---|
| Pieces | Total items processed |
| Value | Monetary value of processed items |
| Scans | Total number of scans performed |
| Full-Time Employees | Count of permanent staff |
| Temp Users | Count of temporary employees |
| Zones | Total non-blocked zones in project |
Productivity

| Metric | Purpose |
|---|---|
| Total Pieces | Overall output tracking |
| Total Stripes Time | Resource utilization |
| Pieces per Hour | Productivity rate |
| Reduced by | Conservative estimates |
| Estimated Pieces per Hour | Realistic projections |
Quality Metrics
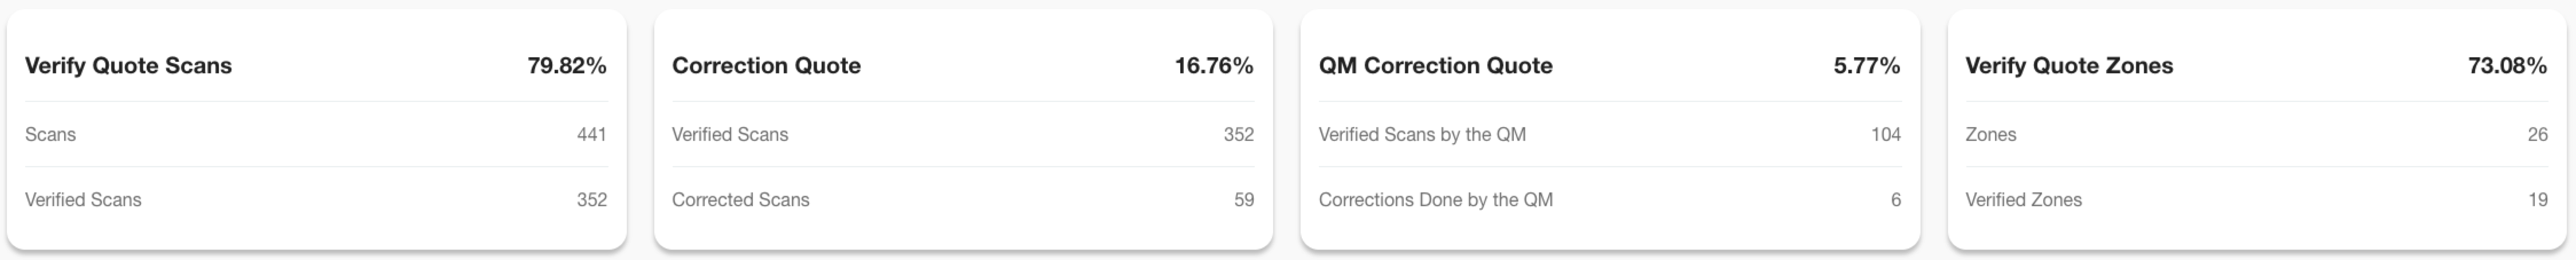
| Metric | Purpose |
|---|---|
| Verify Quote Scans | Shows scan verification coverage |
| Correction Quote | Error rate in verified scans |
| QM Correction Quote | Quality Manager correction rate |
| Verify Quote Zones | Zone-level verification coverage |
Employee Performance Tables

| Metric | Shown Info |
|---|---|
| Pieces Per Hour Tabl | Employee, Per h |
| Verify Time Table | Employee, Zones, Avg Time (s) |
| Corrections Table | Employee, Number |
| Session Corrections Table | Employee, Number (more details in Verify Zone Count) |
Configuration Options
User Type Settings
Include Temp Users on Live Statistics
- Enable/disable done through the Settings
- Effect: Controls whether temporary users are included in calculations
- Impact:
- Enabled: All users contribute to totals
- Disabled: Only full-time employees counted
User Classification:
| Type | Description | Inclusion |
|---|---|---|
| Full | Permanent employees | Always included |
| Temp | Temporary workers | Setting-dependent |
How to Use
Monitoring Project Progress:
- Check ETC for completion timeline
- Review productivity metrics for output rates
- Examine quality quotes for error rates
- Monitor employee performance for bottlenecks
Quality Management:
- Focus on Correction Quote percentages
- Track QM Correction rates
- Identify high-correction employees
- Monitor verification coverage
Team Management:
- Sort employee tables by performance metrics
- Identify top and bottom performers
- Track individual productivity trends
- Plan training based on correction patterns
Performance Analysis:
- Compare pieces per hour across employees
- Analyze verification times for efficiency
- Track correction trends over time
- Use ETC for deadline planning
Troubleshooting
Live Statistics not accessible?
- Verify with your super admin that you have the appropriate permission
- Check if you're registered in the current project
- Contact admin for role assignment
No data showing?
- Ensure work has started on the project (scans/verifications)
- Check if you're in the correct project
- Verify project has active zones
- Wait for data aggregation (updates periodically)
Employee data missing?
- Check that the appropriate setting is enabled
- Verify user types are correctly classified
- Ensure employees have completed work sessions
Timestamps showing incorrect times?
- Check browser timezone settings
- Verify server time synchronization
- Refresh page if times seem stale
Percentages seem wrong?
- Calculations depend on completed work only
- Division by zero shows as "N/A"
- Check underlying data for accuracy
Data not updating?
- Statistics update when work sessions complete
- Real-time updates may have slight delays
- Refresh page if data appears stale
Summary
Live Statistics provides comprehensive project monitoring through:
✅ Real-time productivity tracking with pieces per hour and ETC
✅ Quality management tools with verification and correction rates
✅ Individual performance analytics for all team members
✅ Configurable user inclusion for different workforce types
✅ Responsive interface with sorting and filtering capabilities
✅ Live data updates synchronized with ongoing work