Dashboard
Project Dashboard
The Project Dashboard is a project-specific, customizable dashboard that provides detailed progress tracking and analytics for individual projects through interactive charts and visualizations.
Overview
The Project Dashboard serves as a personalized workspace for:
- Custom Chart Creation - Build tailored project views
- Progress Visualization - Bar and pie chart options
- Team Collaboration - Share charts with project members
- Detailed Analytics - Zone-level and project-level insights
Access Requirements
Required Conditions:
- Active Project Selected - User must be assigned to a project
- Permission: View permission for the current project
- Project Role - Must be registered in the project without any assigned global role
Core Features
Filter & Options Card
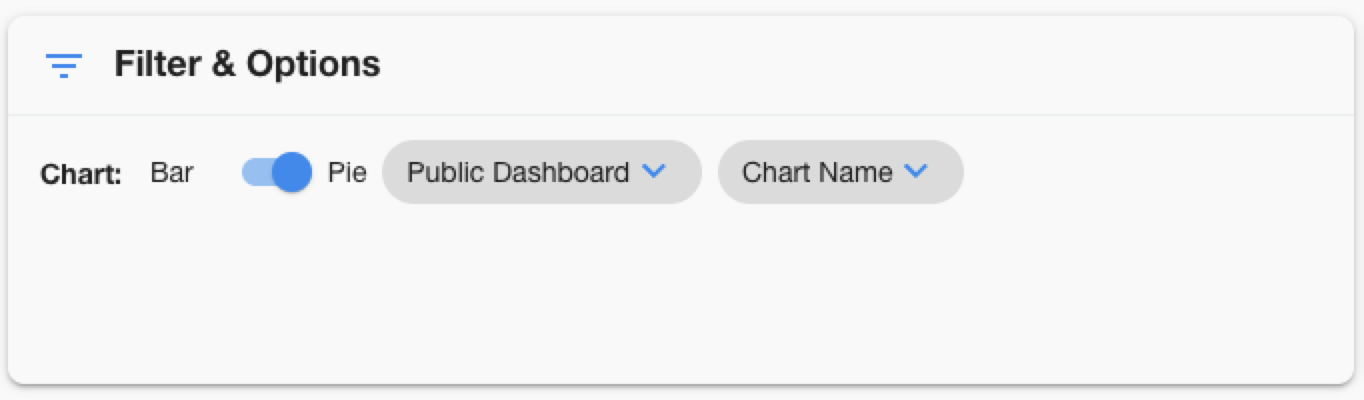
Chart Type Toggle
- Bar Charts: Horizontal progress bars with detailed columns
- Pie Charts: Circular visualizations in grid layout
- Toggle Switch: Seamless switching between view types
Dashboard Selection
| Option | Description | Access Level |
|---|---|---|
| My Dashboard | Personal charts created by you | Private to user |
| Public Dashboard | Charts shared by team members | Project-wide access |
Chart Filtering (when multiple charts exist)
- Chart Name Filter - Show/hide specific charts
- Selective Visibility - Control which charts display
- Dynamic Updates - Real-time filtering
Sort By Card
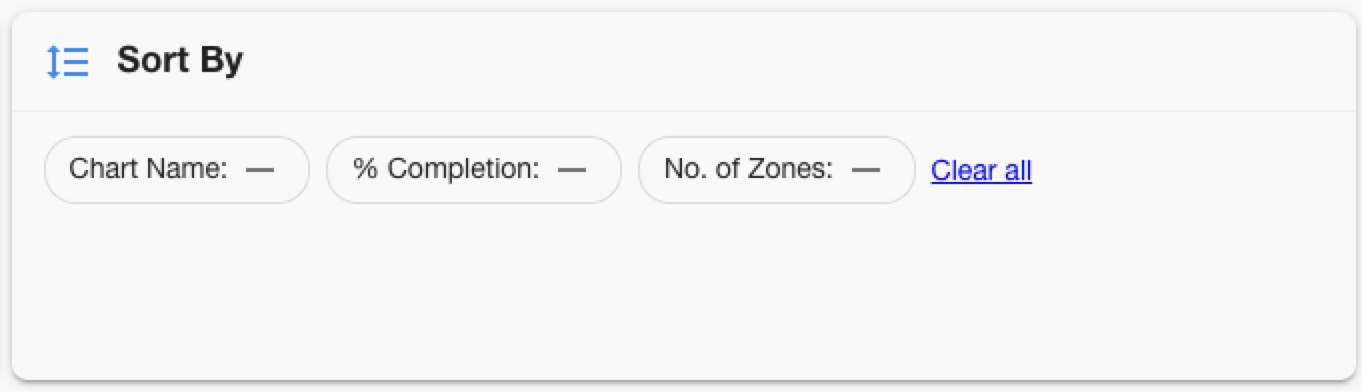
Sort Options:
| Field | Description | Use Case |
|---|---|---|
| Chart Name | Alphabetical by title | Organization |
| % Completion | Progress percentage | Priority identification |
| No. of Zones | Total zones in chart | Scope comparison |
| ETC | Estimated time to completion | Timeline management |
Sort Direction:
- Ascending: Low to high values
- Descending: High to low values
Project Overview Card
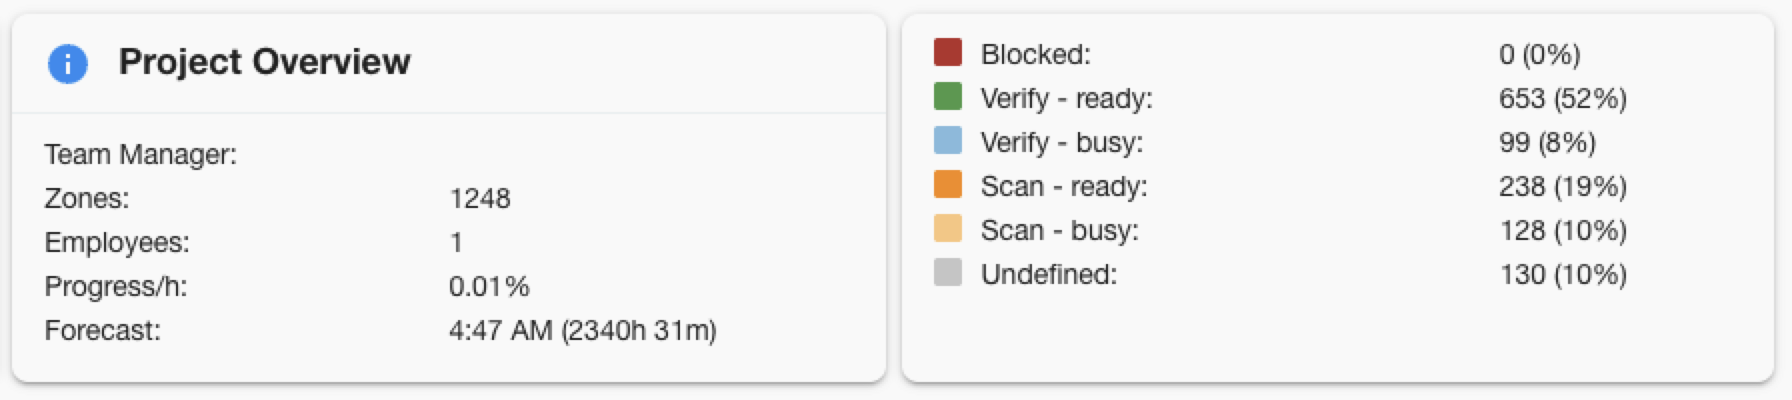
Displayed Information:
| Metric | Description | Source |
|---|---|---|
| Team Manager | Project supervisor name | Registration data |
| Zones | Total zones in project | Zone count |
| Employees | Team member count | Active registrations |
| Progress/Hour | Productivity rate | Calculated metric |
| Forecast | Completion time estimate | ETC calculation + current time |
| Zones Status | Number of zones and completion % on each status | Zones |
Sharing Option
As a project user, you have the option to share your current view of the project's dashboard through Stripes' Customer Portal (if used) by following the below steps:
- Click on

- Set a password to be shared with the link receiver
- The system will generate a link and a QR code which you can share along with the provided password
- You have the option to reset the password, if needed
- Everyone with access to this URL and the set password will be able to view the project until it closes
Chart Types & Visualizations
Bar Chart View
Column Structure:
| Column | Content |
|---|---|
| Project Info | Title, subtitle, client details |
| Overall % | Completion percentage |
| ETC | Time estimate + forecast |
| In Progress | Active work indicators |
| Status Bar | Color-coded zone status |
| Total Zones | Zone count |
| Actions | Menu options |
Pie Chart View
Action Buttons:
| Button | Icon | Function | Availability |
|---|---|---|---|
| Edit | Modify chart filters | Creator or admin | |
| Remove | Delete chart | Creator or admin | |
| Use | N/A | Apply chart filters | All users |
Chart Management
Creating New Charts
Button: ![]()
Creation Process:
- Click Add Chart button
- Define chart title and subtitle
- Set filter criteria (zones, status, etc.)
- Choose visibility (private or public)
- Save and view new chart
Filter Options:
- Zone Status - Filter by workflow state
- Zone Properties - Warehouse, division, flags
- Date Ranges - Time-based filtering
- Custom Attributes - Project-specific fields
Editing Existing Charts
Access: Chart creator or users with the appropriate permission
Editable Properties:
- Chart title and subtitle
- Filter criteria and conditions
- Visibility settings (private/public)
- Display preferences
Removing Charts
Access: Same as editing permissions
Safety Features:
- Confirmation dialog before deletion
- No undo - permanent removal
- Creator protection - others can't delete your private charts
Sharing & Collaboration
Dashboard Modes
My Dashboard (Private)
- Personal charts created by you
- Private visibility - only you can see
- Full control - edit, delete, organize
- No public charts created by you shown here
Public Dashboard (Shared)
- Team charts marked as public
- Shared visibility - all project members can see
- Limited control - use and view only (unless admin)
- Collaborative workspace for team insights
Chart Sharing Process
- Create chart in My Dashboard
- Mark as Public during creation/editing
- Chart becomes visible in Public Dashboard
- Team members can use but not modify (unless admin)
Troubleshooting
Project Dashboard not showing?
- Verify you have the View permission for current project
- Check if you're assigned to an active project
- Ensure project registration is current and active
- Contact project manager for access issues
Charts not loading?
- Check internet connection for real-time updates
- Refresh browser if charts appear stuck
- Verify chart filters aren't too restrictive
- Clear browser cache if persistent issues
Can't create new charts?
- Ensure you're in "My Dashboard" mode
- Check if you have chart creation permissions
- Verify project has zones to chart
- Try refreshing page if button is unresponsive
Can't edit/remove charts?
- Only chart creators can edit private charts
- Need the appropriate permission for public charts
- Switch to correct dashboard mode (My/Public)
- Check if chart exists and you have access
Dashboard mode switching not working?
- Verify you have access to both personal and public charts
- Check if project has public charts available
- Refresh page if toggle is unresponsive
- Ensure user preferences are being saved
Mobile view issues?
- Use dropdown arrows to expand card content
- Scroll horizontally for wide charts
- Tap elements instead of hover for interactions
- Rotate device if layout appears cramped